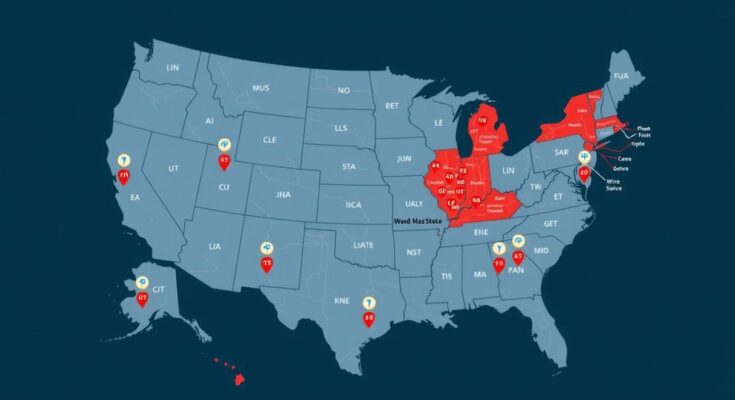
Ahead of the US elections on November 5, 2024, Al Jazeera presents 20 maps analyzing various aspects of the country, including economic performance by state, unemployment rates, minimum wage standards, income tax rates, homelessness prevalence, wealth distribution, and demographic data. This analysis highlights the disparities across states and the significant issues that will influence voter behavior in the upcoming election.
As the United States approaches the pivotal elections on November 5, 2024, Al Jazeera’s analysis offers an insightful examination of the nation through the lens of 20 informative maps. These visual representations explore critical aspects of the U.S., including its economy, demographics, geography, and historical context, which are essential for understanding the voting landscape of the country’s 335 million inhabitants. In terms of economic strength, the U.S. boasts the largest gross domestic product globally, which stands at $29 trillion. California, Texas, and New York are identified as the leaders in state economies, each with GDP figures that rival those of entire countries. Furthermore, unemployment rates, currently at 4.1 percent nationally, highlight disparities across states, with the District of Columbia, Nevada, and California experiencing the highest unemployment, while South Dakota leads with the lowest. The discourse around minimum wage remains a prominent topic, particularly with Democratic leaders aiming to raise the federal standard from the stagnant rate of $7.25 per hour. California features the highest state-specific minimum wage, while a few states, notably Georgia and Wyoming, fall beneath this federal threshold. California also has the steepest income tax obligations for high earners, reflecting its progressive tax structure, while states such as Texas and Wyoming impose no income tax. The alarming issue of homelessness has reached unprecedented levels, with data indicating that 20 out of every 10,000 individuals is experiencing homelessness, particularly noted in urban centers like Washington, D.C. and New York. The wealth distribution in the U.S. is noteworthy, as it houses a significant proportion of the world’s billionaires. States vary greatly in population size, with California hosting the largest demographic at approximately 39 million. The state-by-state analysis reveals diverse racial and ethnic compositions, with significant trends in immigration highlighted by California’s substantial immigrant population. Additionally, the youth vote, which constitutes 9 percent of the U.S. populace, varies in representation across states, predominantly seen in Utah. Public health issues are underscored by the distressing maternal mortality rates, with states like Arkansas and Mississippi reporting the highest figures. Tragically, the U.S. grapples with high rates of suicide and violence, with Montana noted for its alarming suicide statistics, and the highest rates of violent crime concentrated within the District of Columbia. Gun violence remains a national crisis, further complicated by mass shootings that have escalated in recent years, predominantly in states such as Illinois and California. The legal landscape surrounding capital punishment and abortion has also evolved, reflecting deep societal divisions. With 21 states enforcing the death penalty and many others imposing strict regulations on abortion following the reversal of Roe v. Wade, these issues are expected to influence voter decisions significantly. Understanding how each state contributes to the fabric of the nation, from geographic size comparisons to historical timelines of statehood, provides clarity on the complexities voters face as the election date approaches.
With the upcoming elections on November 5, 2024, the examination of the United States through comprehensive mapping can provide valuable insights into the socio-economic and political climate. The nation is characterized by significant diversity in terms of economic conditions, demographic composition, and public policy impacts, especially in key issues such as immigration, labor markets, taxation, and social services. Mapping presents a unique opportunity to visualize these elements, which are critical as voters prepare to make informed decisions at the polls.
In summary, the information gathered from these 20 maps reveals multifaceted insights into the economic, demographic, and social landscapes of the United States as it approaches the 2024 elections. Key issues such as economic disparities, homelessness, taxation, and health-related challenges illustrate the critical realities faced by voters. This comprehensive overview underscores the necessity for informed decision-making among the electorate, who will ultimately shape the future direction of the nation. As such, understanding these dynamics may prove essential for stakeholders invested in the outcome of the elections.
Original Source: www.aljazeera.com


